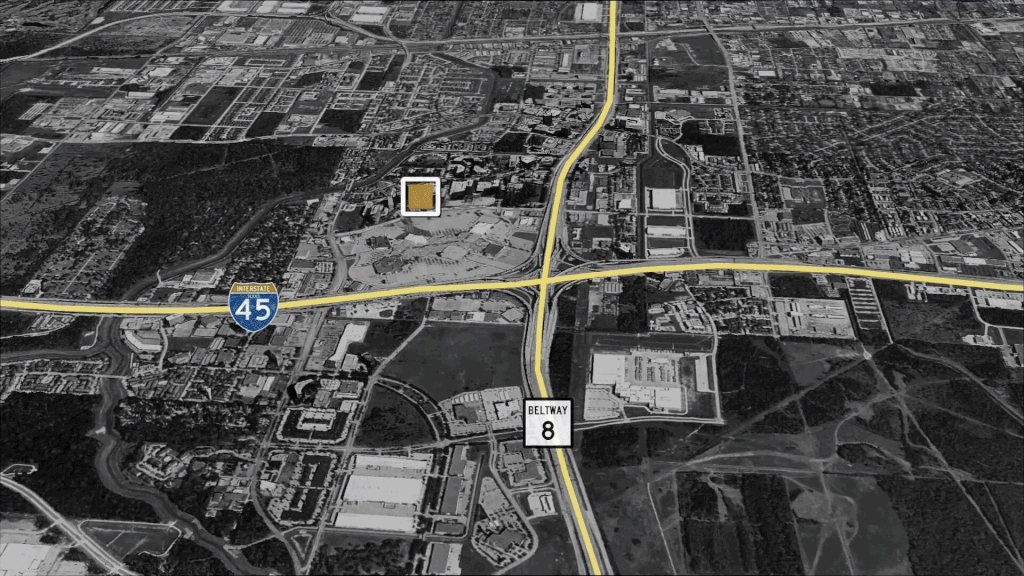
The region has a civilian labor force of 827,943 with a participation rate of 67.0%. Of individuals 25 to 64 in the NHA Service Area*, 31.4% have a bachelor’s degree or higher which compares with 32.3% in the nation. The median household income in the NHA Service Area* is $72,381 and the median house value is $186,973.
| Summary1 | Percent | Value | ||||
| Proxy for NHA Service Area* | Texas | USA | Proxy for NHA Service Area* | Texas | USA | |
| Demographics | ||||||
| Population (ACS) | — | — | — | 1,653,865 | 27,419,612 | 321,004,407 |
| Male | 49.2% | 49.7% | 49.2% | 813,281 | 13,616,977 | 158,018,753 |
| Female | 50.8% | 50.3% | 50.8% | 840,584 | 13,802,635 | 162,985,654 |
| Median Age2 | — | — | — | 34.5 | 34.3 | 37.8 |
| Under 18 Years | 28.3% | 26.3% | 22.9% | 468,399 | 7,213,117 | 73,601,279 |
| 18 to 24 Years | 8.8% | 10.0% | 9.7% | 145,350 | 2,752,064 | 31,131,484 |
| 25 to 34 Years | 14.2% | 14.6% | 13.7% | 235,222 | 4,002,129 | 44,044,173 |
| 35 to 44 Years | 14.2% | 13.5% | 12.7% | 235,534 | 3,705,119 | 40,656,419 |
| 45 to 54 Years | 13.1% | 12.7% | 13.4% | 217,479 | 3,494,999 | 43,091,143 |
| 55 to 64 Years | 11.1% | 11.1% | 12.7% | 183,994 | 3,036,278 | 40,747,520 |
| 65 to 74 Years | 6.6% | 7.0% | 8.6% | 109,904 | 1,915,612 | 27,503,389 |
| 75 Years, and Over | 3.5% | 4.7% | 6.3% | 57,983 | 1,300,294 | 20,229,000 |
| Race: White | 71.5% | 74.6% | 73.0% | 1,182,620 | 20,459,525 | 234,370,202 |
| Race: Black or African American | 14.8% | 12.0% | 12.7% | 244,801 | 3,286,950 | 40,610,815 |
| Race: American Indian and Alaska Native | 0.4% | 0.5% | 0.8% | 6,383 | 130,360 | 2,632,102 |
| Race: Asian | 5.2% | 4.5% | 5.4% | 86,096 | 1,236,852 | 17,186,320 |
| Race: Native Hawaiian and Other Pacific Islander | 0.1% | 0.1% | 0.2% | 2,177 | 23,531 | 570,116 |
| Race: Some Other Race | 5.6% | 5.8% | 4.8% | 92,209 | 1,580,393 | 15,553,808 |
| Race: Two or More Races | 2.4% | 2.6% | 3.1% | 39,579 | 702,001 | 10,081,044 |
| Hispanic or Latino (of any race) | 31.1% | 38.9% | 17.6% | 514,028 | 10,673,909 | 56,510,571 |
| Economic | ||||||
| Labor Force Participation Rate and Size (civilian population 16 years and over) | 67.0% | 64.4% | 63.3% | 827,943 | 13,473,957 | 161,159,470 |
| Prime-Age Labor Force Participation Rate and Size (civilian population 25-54) | 81.1% | 80.2% | 81.6% | 557,865 | 8,945,583 | 103,761,701 |
| Armed Forces Labor Force | 0.1% | 0.4% | 0.4% | 706 | 91,081 | 1,024,855 |
| Veterans, Age 18-64 | 4.5% | 5.2% | 4.9% | 46,036 | 872,423 | 9,667,749 |
| Veterans Labor Force Participation Rate and Size, Age 18-64 | 81.8% | 77.6% | 75.8% | 37,636 | 677,079 | 7,326,514 |
| Median Household Income2 | — | — | — | $72,381 | $57,051 | $57,652 |
| Per Capita Income | — | — | — | $32,502 | $28,985 | $31,177 |
| Poverty Level (of all people) | 12.4% | 16.0% | 14.6% | 203,577 | 4,291,384 | 45,650,345 |
| Households Receiving Food Stamps/SNAP | 9.7% | 12.7% | 12.6% | 53,985 | 1,196,016 | 15,029,498 |
| Mean Commute Time (minutes) | — | — | — | 32.0 | 26.1 | 26.4 |
| Commute via Public Transportation | 1.7% | 1.5% | 5.1% | 13,252 | 187,311 | 7,607,907 |
| Educational Attainment, Age 25-64 | ||||||
| No High School Diploma | 13.9% | 16.1% | 11.4% | 121,609 | 2,287,734 | 19,230,541 |
| High School Graduate | 23.4% | 24.7% | 26.0% | 204,415 | 3,517,552 | 43,784,920 |
| Some College, No Degree | 23.6% | 22.4% | 21.2% | 205,584 | 3,183,316 | 35,803,629 |
| Associate's Degree | 7.6% | 7.4% | 9.0% | 66,385 | 1,051,162 | 15,199,517 |
| Bachelor's Degree | 21.8% | 19.7% | 20.5% | 189,845 | 2,808,143 | 34,602,913 |
| Postgraduate Degree | 9.7% | 9.8% | 11.8% | 84,391 | 1,390,618 | 19,917,735 |
| Housing | ||||||
| Total Housing Units | — | — | — | 599,786 | 10,611,386 | 135,393,564 |
| Median House Value (of owner-occupied units)2 | — | — | — | $186,973 | $151,500 | $193,500 |
| Homeowner Vacancy | 1.3% | 1.6% | 1.7% | 5,023 | 94,134 | 1,346,331 |
| Rental Vacancy | 7.4% | 7.6% | 6.1% | 15,282 | 300,975 | 2,838,344 |
| Renter-Occupied Housing Units (% of Occupied Units) | 33.9% | 38.0% | 36.2% | 188,726 | 3,579,373 | 42,992,786 |
| Occupied Housing Units with No Vehicle Available (% of Occupied Units) | 3.9% | 5.5% | 8.8% | 21,465 | 517,945 | 10,468,418 |
| Social | ||||||
| Enrolled in Grade 12 (% of total population) | 1.6% | 1.5% | 1.4% | 26,305 | 398,124 | 4,437,324 |
| Disconnected Youth4 | 3.3% | 3.0% | 2.7% | 3,060 | 47,251 | 456,548 |
| Children in Single Parent Families (% of all children) | 31.9% | 34.9% | 34.5% | 143,727 | 2,396,094 | 24,106,567 |
| With a Disability, Age 18-64 | 8.2% | 9.7% | 10.3% | 82,668 | 1,613,122 | 20,276,199 |
| With a Disability, Age 18-64, Labor Force Participation Rate and Size | 47.3% | 44.4% | 41.4% | 39,114 | 716,525 | 8,395,884 |
| Foreign Born | 17.8% | 16.9% | 13.4% | 294,702 | 4,622,395 | 43,028,127 |
| Speak English Less Than Very Well (population 5 yrs and over) | 14.2% | 14.1% | 8.5% | 217,674 | 3,576,480 | 25,654,421 |
| Union Membership | ||||||
| Total3 | 3.6% | 4.3% | 10.5% | — | — | — |
| Private Sector3 | 2.0% | 2.4% | 6.3% | — | — | — |
| Manufacturing3 | 3.1% | 4.2% | 8.6% | — | — | — |
| Public Sector3 | 16.0% | 14.5% | 34.6% | — | — | — |